

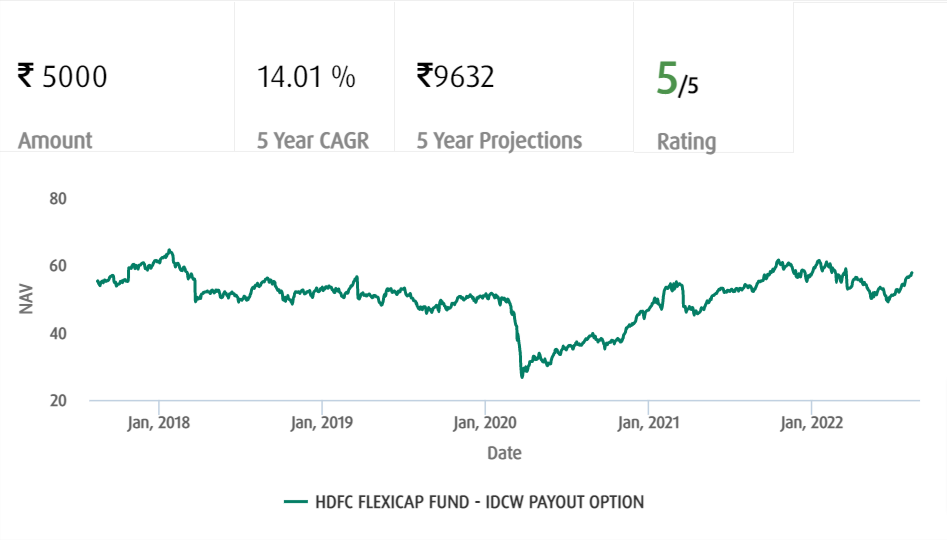
HDFC Flexicap Fund- IDCW Payout Option
(Note: Based on the data as of 12th August 2022)
Suitability
This scheme is suitable for those investors who are looking for high returns by making investment over a period of 3-4 years but the scheme carries moderate risk of loss in the value of investments.
Scheme Details
|
Scheme Launch Date |
January 1995 |
|
Scheme Type |
Open Ended Fund- Equity |
|
Minimum Investment Amount |
Rs. 5,000 (Initial); Rs. 1,000 (Additional) |
|
Minimum SIP Amount |
Rs. 300 |
|
Expense Ratio |
1.75% |
|
Fund Managers |
Roshi Jain |
|
Exit Load |
Entry Load: Nil & Exit Load: 1% of sales value if sold before 365 days |
|
Risk |
Moderate |
|
AUM (in Cr.) |
Rs. 29096.42 |
|
Investment Horizon |
Mid Term to Long Term |
About Fund Managers:
The Fund is managed by the following fund managers:
|
Roshi Jain |
Roshi Jain is a CFA, CA and PGDM. She has previously worked with Franklin Templeton Investments, Goldman Sachs, Wipro Ltd. and S.R. Batliboi & Co. |
Trailing Returns (%)
|
|
YTD |
1-Day |
1-W |
1-M |
3-M |
6-M |
1-Y |
3-Y |
5-Y |
7-Y |
10-Y |
|
HDFC Flexicap Fund- IDCW Payout |
11.29 |
0.39 |
2.37 |
10.24 |
14.82 |
7.10 |
19.38 |
19.12 |
12.65 |
12.65 |
15.09 |
Benchmark Returns:
|
|
1 Year Return |
3 Year Return |
5 Year Return |
10 Year Return |
Returns since inception |
|
Nifty 500 TRI |
60.77 |
15.00 |
15.40 |
12.81 |
18.43 |
Peer Comparison
|
Mutual Fund |
Rating |
NAV |
1 Yr Return |
3 Yr Return |
5 Yr Return |
10 Yr Return |
Return Since Inception |
|
5 |
164.68 |
-1.01 |
21.17 |
15.25 |
15.80 |
12.84 |
|
|
5 |
45.99 |
4.95 |
20.08 |
14.59 |
14.78 |
17.84 |
|
|
5 |
41.11 |
12.65 |
19.11 |
12.56 |
16.50 |
12.81 |
|
|
5 |
17.63 |
-0.47 |
25.49 |
15.22 |
NA |
13.23 |
|
|
5 |
- |
5.97 |
25.21 |
18.62 |
- |
- |
Fund Allocations: The fund has approx. 95.50% investment in domestic equities of which 73.16% is in large cap stocks, 8.92% in mid-cap stocks, 4.62% in small-cap stocks.
Top 10 Companies in Portfolio
|
Company Name |
Sector |
P/E |
% Assets |
|
State Bank of India |
Financial |
13.41 |
7.94 |
|
ICICI Bank Ltd. |
Financial |
21.96 |
7.60 |
|
Infosys Ltd. |
Technology |
30.12 |
5.80 |
|
HDFC Bank Ltd. |
Financial |
20.78 |
5.58 |
|
Reliance Industries Ltd. |
Refinery |
26.83 |
5.43 |
|
ITC |
Consumer Staples |
23.35 |
4.56 |
|
Coal India |
Materials |
5.93 |
4.44 |
|
NTPC |
Energy |
9.34 |
4.36 |
|
Larsen & Toubro |
Construction |
28.17 |
4.26 |
|
HDFC |
Financial |
19.49 |
3.48 |
Sector-wise Allocation of Fund
|
Sector |
Allocation of Assets (%) |
|
Basic Materials |
1.19 |
|
Consumer Cyclical |
3.80 |
|
Financial Services |
38.29 |
|
Real Estate |
0.00 |
|
Communication Services |
3.70 |
|
Energy |
13.37 |
|
Industrials |
13.82 |
|
Technology |
10.26 |
|
Consumer Defensive |
4.77 |
|
Healthcare |
4.47 |
Disclaimer: Mutual Funds investments are subject to market risk. Therefore, it is advised to read the scheme documents carefully before making any investment. The above figures are based on the market data of the various mutual funds over the period and should not be solely made the basis of investment. Taxwink shall not be responsible for any loss caused to any person in any manner on any investment made on the basis of the above information.